Eleven Years of Gender Data Visualization: A Step Towards More Inclusive Gender Representation
Abstract
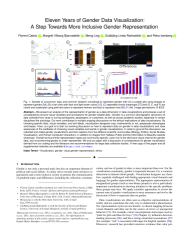
We present an analysis of the representation of gender as a data dimension in data visualizations and propose a set of considerations around visual variables and annotations for gender-related data. Gender is a common demographic dimension of data collected from study or survey participants, passengers, or customers, as well as across academic studies, especially in certain disciplines like sociology. Our work contributes to multiple ongoing discussions on the ethical implications of data visualizations. By choosing specific data, visual variables, and text labels, visualization designers may, inadvertently or not, perpetuate stereotypes and biases. Here, our goal is to start an evolving discussion on how to represent data on gender in data visualizations and raise awareness of the subtleties of choosing visual variables and words in gender visualizations. In order to ground this discussion, we collected and coded gender visualizations and their captions from five different scientific communities (Biology, Politics, Social Studies, Visualisation, and Human-Computer Interaction), in addition to images from Tableau Public and the Information Is Beautiful awards showcase. Overall we found that representation types are community-specific, color hue is the dominant visual channel for gender data, and nonconforming gender is under-represented. We end our paper with a discussion of considerations for gender visualization derived from our coding and the literature and recommendations for large data collection bodies. A free copy of this paper and all supplemental materials are available at https://osf.io/v9ams/.
Fichier principal
 [final]VIS23__camera_version_Gendered_data_visualisation__11_year_analysis.pdf (4.33 Mo)
Télécharger le fichier
[final]VIS23__camera_version_Gendered_data_visualisation__11_year_analysis.pdf (4.33 Mo)
Télécharger le fichier
 supratest3.png (230.78 Ko)
Télécharger le fichier
supratest3.png (230.78 Ko)
Télécharger le fichier
Origin : Files produced by the author(s)
Format : Figure, Image